Step 14 - Explore the lab tools for monitoring NGINX Plus
In the browser, click
Arcadia links>WAF NGINX Ingressbookmark (you may have to refresh on the browser if you get an error)You are now connected to the Arcadia App through the Kubernetes Ingress Controller with NAP
Send an attack (like a XSS in the address bar) by appending
?a=<script>Open
Kibanabookmark and click onDiscoverto view the logs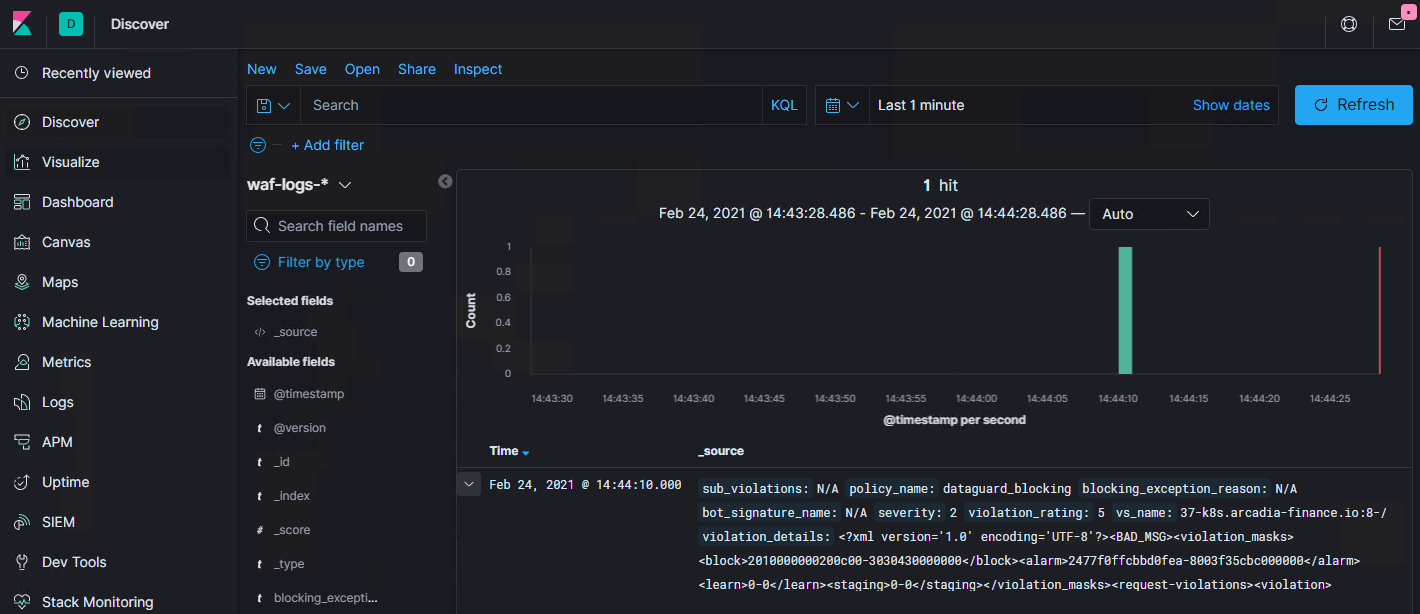
View the dashboard in Kibana:
Firefox>Kibana>Dashboard>OverviewNote
While monitoring is not solely an API security concern, having a real-time dashboard is helpful in understanding current issues and traffic load. In the following steps, we will look at the NGINX Plus dashboard to see how it can help.
In the browser, open
NGINX Plus Dashboards>k8s NGINX+ DashboardNote the tab for
HTTP Zoneswhere we can see the Ingresses and VirtualServers deployed fork8s.arcadia-finance.ioand the real-time metrics. You can change the refresh interval by clicking the gear in the upper-right corner.
At the top of the menu, click the link for
HTTP Upstreams. Here you can see the pods that are part of each of the Arcadia micro-services.
Note
We have only deployed 1 pod per service. In production environments, it is common for there to be many pods per service and the KIC will load balance them.
Optional: Scale the
app2deployment to 3 pods and view the dashboard again.kubectl scale deployment app2 --replicas 3
Note
When pods are scaled up and down, NGINX Plus does not have to reload as it uses an internal API call to update the upstreams- dramatically reducing overhead in dynamic environments.