Step 16 - Bot Protection
Bot signatures provide basic bot protection by detecting bot signatures in the User-Agent header and URI. The bot-defense section in the policy is enabled by default.
Each bot signature belongs to a bot class. Search engine signatures such as googlebot are under the trusted_bots class, but App-Protect performs additional checks of the trusted bot’s authenticity.
If these checks fail, it means that the respective client impersonated the “search engine” in the signature and it will be classified as class - malicous_bot, anomaly - Search engine verification failed, and the request will be blocked, irrespective of the class’s mitigation actions configuration.
An action can be configured for each bot class, or may also be configured per each bot signature individually:
ignore- bot signature is ignored (disabled)detected- only report without raising the violation - VIOL_BOT_CLIENT. The request is considered legal unless another violation is triggered.alarm- report, raise the violation, but pass the request. The request is marked as illegal.block- report, raise the violation, and block the request
Note
We could stop the lab here, and run Bot requests. As Bot protection is enabled by default, the default protection will apply. But in order to understand to customize the config, let’s create a new Policy JSON file.
Steps for the lab
SSH the centos-vm
Test to see if NGINX is running by
curl 0if you get response that looks like html, it is running. Otherwise run:/home/centos/lab-files/lab-script-cheat.shView our new NAP policy JSON file with Bot protections:
Note
The default actions for classes are:
detect for trusted-bot,alarm for untrusted-bot, andblock for malicious-bot. In this example, we enabled bot defense and specified that we want to raise a violation for trusted-bot, and block for untrusted-bot.cat /home/centos/lab-files/bot-policy/policy_bots.jsonpolicy_bots.json{ "policy": { "name": "bot_defense_policy", "template": { "name": "POLICY_TEMPLATE_NGINX_BASE" }, "applicationLanguage": "utf-8", "enforcementMode": "blocking", "bot-defense": { "settings": { "isEnabled": true }, "mitigations": { "classes": [ { "name": "trusted-bot", "action": "alarm" }, { "name": "untrusted-bot", "action": "block" }, { "name": "malicious-bot", "action": "block" } ] } } } }
We will modify the
arcadia.confto reference this new policy json file.cat /home/centos/lab-files/bot-policy/conf.d/arcadia.confserver { listen 80 default_server; proxy_http_version 1.1; proxy_cache_bypass $http_upgrade; proxy_set_header X-Forwarded-Server $host; proxy_set_header X-Forwarded-For $proxy_add_x_forwarded_for; proxy_set_header Upgrade $http_upgrade; proxy_set_header Connection "upgrade"; proxy_ignore_client_abort on; client_max_body_size 0; default_type text/html; app_protect_enable on; app_protect_security_log_enable on; # send the logs to the logstash instance on our ELK stack. app_protect_security_log "/etc/app_protect/conf/log_default.json" syslog:server=10.1.1.11:5144; ## our new bot policy app_protect_policy_file "/etc/nginx/policy_bots.json"; ## NGINX Plus API monitoring: status_zone arcadia_server; ## in this lab, there are 2 ingress definitions for arcadia ## no-waf is the ingress (virtualServer) without NAP enabled proxy_set_header Host no-waf.arcadia-finance.io; # main service location / { proxy_pass http://arcadia_ingress_nodeports$request_uri; status_zone main_service; } # backend service location /files { proxy_pass http://arcadia_ingress_nodeports$request_uri; status_zone backend_service; } # app2 service location /api { proxy_pass http://arcadia_ingress_nodeports$request_uri; status_zone app2_service; } # app3 service location /app3 { proxy_pass http://arcadia_ingress_nodeports$request_uri; status_zone app3_service; } } upstream arcadia_ingress_nodeports { zone arcadia_ingress_nodeports 128k; server rke1:80; }
Copy our files and reload NGINX
Generate simulated Bot traffic
On the jump host browser
Arcadia Links>Arcadia NAP CentOSNow, on the
Desktop, launchJmeterIn Jmeter, open the project in
File>>Open Recent>>HTTP Request Bots.jmx. This file is located in folder Desktop > lab-links > jmeter_files
Now, run the project by click on the
GREEN PLAY BUTTON
THe project is sending HTTP requests to the NAP with a public IP address (known as
bad reputation) and with a BotUser-Agent. We will simulate bots by changing the user agent.You can expand
Thread Groupand click onView Results Treeto see each request sent.Now, go to
KibanafromFirefox Browser, Click on Dashboards thenOverviewdashboard.You can notice Good and Bad request in the widgets, but let’s focus on the logs at the bottom of the dashboard
Open the logs in full screen
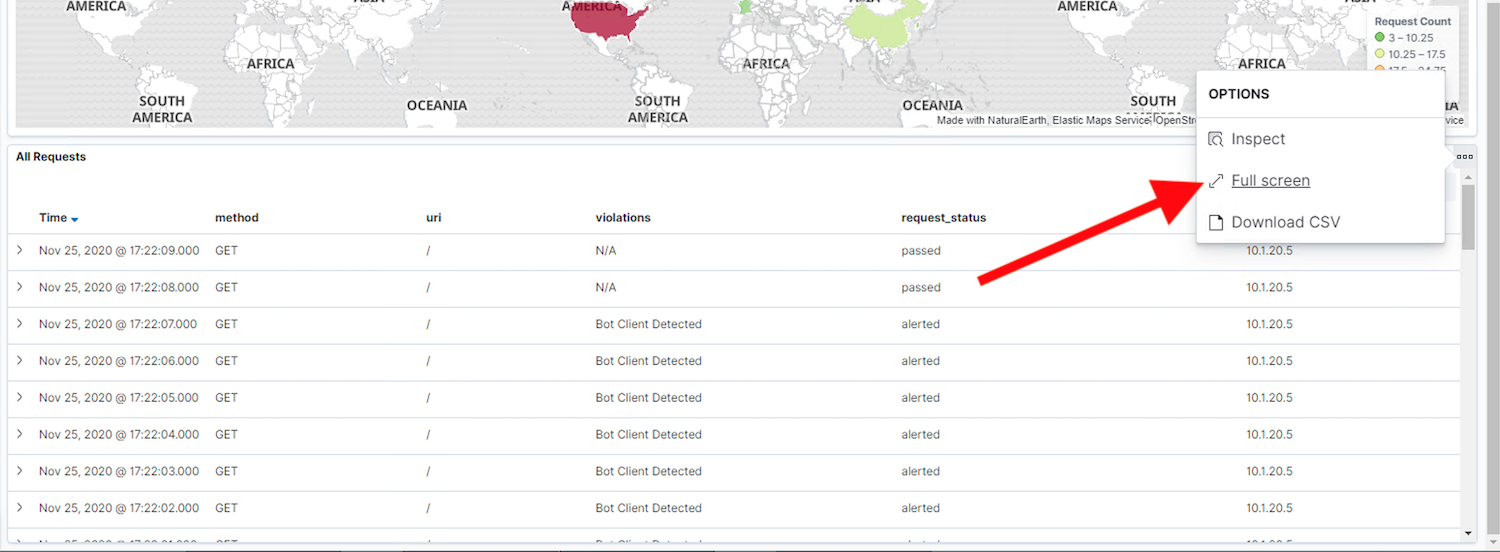
Look at the logs, and open up one or two logs
alertedorblocked. You can notice theBot Category, theviolation…
Note
Now, your NAP is protecting against known bots and you can customize your policy in order to make it more strick or not.