Step 4 - Check logs in Kibana
In this lab we will check the logs in the ELK stack (Elastic, Logstash, Kibana)
Understanding how to configure the destination syslog server
Steps:
With vscode or Windows Terminal ssh to the centos-vm
View
cat /etc/app_protect/conf/log_default.json(which is also pasted below) which was edited in the previous lab.log_default.json{ "filter": { "request_type": "all" }, "content": { "format": "default", "max_request_size": "any", "max_message_size": "5k" } }Note
By default
/etc/app_protect/conf/log_default.jsonwhich is installed with app protect, will only log illegal requests, it should have been edited by you to log all requests.Recall line 33 from the NGINX configuration we are using (Feel free to open
/etc/nginx/nginx.conf)nginx.confuser nginx; worker_processes auto; error_log /var/log/nginx/error.log notice; # load the app protect module load_module modules/ngx_http_app_protect_module.so; events { worker_connections 1024; } http { include /etc/nginx/mime.types; default_type application/octet-stream; sendfile on; keepalive_timeout 65; log_format main '$remote_addr - $remote_user [$time_local] "$request" ' '$status $body_bytes_sent "$http_referer" ' '"$http_user_agent" "$http_x_forwarded_for"'; # note that in the dockerfile, the logs are redirected to stdout and can be viewed with `docker logs` access_log /var/log/nginx/access.log main; server { listen 80; server_name localhost; proxy_http_version 1.1; proxy_cache_bypass $http_upgrade; proxy_set_header Host $host; proxy_set_header X-Forwarded-Server $host; proxy_set_header X-Forwarded-For $proxy_add_x_forwarded_for; proxy_set_header Upgrade $http_upgrade; proxy_set_header Connection "upgrade"; proxy_ignore_client_abort on; app_protect_enable on; app_protect_security_log_enable on; # send the logs to the logstash instance on our ELK stack. app_protect_security_log "/etc/app_protect/conf/log_default.json" syslog:server=10.1.1.11:5144;Note
You will notice in the
nginx.conffile the reference tolog_default.jsonand the remote syslog server (ELK)10.1.1.11:5144Open Kibana via firefox on the jumphost or via UDF access
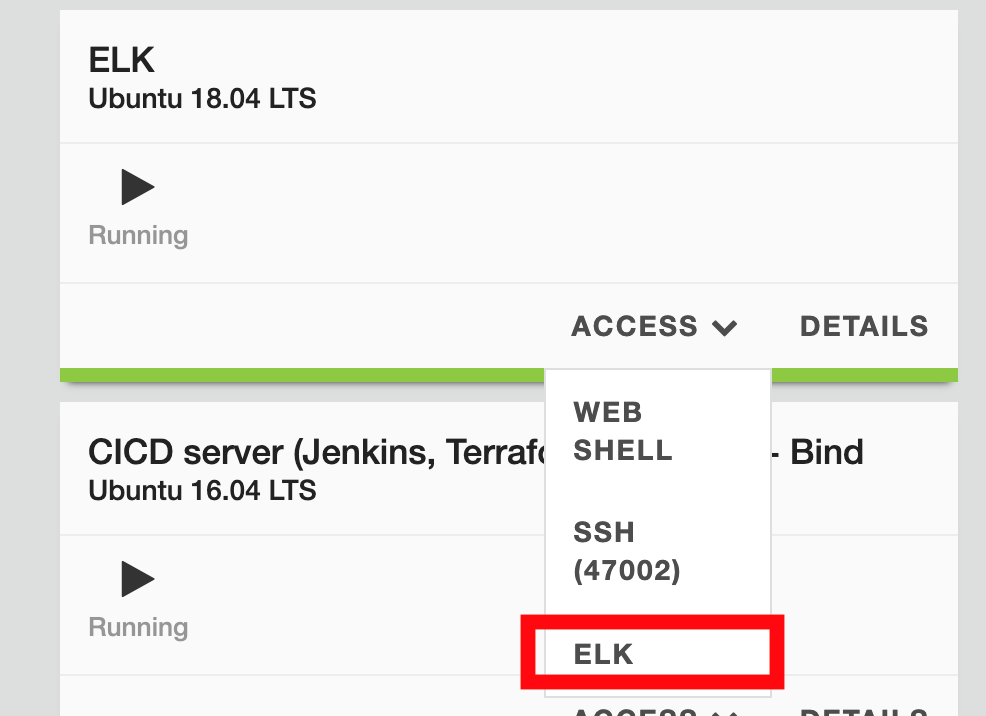
In UDF, find the ELK VM and click Access > ELK
In Kibana, click on
Dashboard > Overview
At the bottom of the dashboard, you can see the logs. Select one of the log entries and check the content
Note
You may notice the log content is similar to F5 ASM and Adv. WAF
Note
The default time window in this Kibana dashboard is Last 15 minutes. If you do not see any requests, you may need to extend the time window to a larger setting. It can take a minute for logs to be processed into the graphs.
Video of this lab (force HD 1080p in the video settings)